Have Bethel’s women been more likely to study certain fields than others? Have some majors historically been dominated by women, or by men? Has that changed over the years?
I’m not certain yet that I’ll dedicate a page at the finished Women of Bethel project to these questions, but I have been wondering how I might go about answering them. So far two sources suggest themselves.
Yearbook Photos
At least some of Bethel’s yearbooks not only include photographs of seniors but also list their majors. This is obviously an imperfect way to answer my questions about majors: the yearbooks clearly leave out some students’ photos, I’m not sure how reliable the lists of majors are, and even in an era when there was less debate about gender identity, it’s not always easy to tell distinguish a male-female binary from names and images. But it gives us something to work with for years when more precise statistics weren’t reported or preserved.
Let’s start again with the yearbook for 1972-73, the first year Bethel College held classes on the Arden Hills campus. That edition of The Spire included the photos of 123 seniors — 52% of them women — plus their majors. Leaving out programs that had fewer than five students, here’s how they broke down in quartiles:
PREDOMINANTLY WOMEN (75% or more women) IN 1972-73
Elementary Education (92%)
MOSTLY WOMEN (50-74% women) IN 1972-73
English (71%), all Secondary Education (67% — English, Social Studies, Physical Education), Music Education (64%), Psychology (60%), Sociology (56%)
MOSTLY MEN (25-49% women) IN 1972-73
Chemistry (43%), Christianity (40%), Biblical and Theological Studies (33%)
PREDOMINANTLY MEN (0-24% women) IN 1972-73
Art (29%), Biology (0%)
Philosophy, Economics, History, and Math-Physics didn’t have enough graduates depicted that year to qualify, but those programs also graduated only men in 1972-73.
By contrast, if we go back twenty years to the 1952-53 Spire, we find women accounting for half as big a share (26%) of a class that was a third the size of the first to finish in Arden Hills. Not surprisingly, then, we find only two majors dominated by women: Bible and Religious Education (all three of its graduates that year were women) and Literature (five of seven). Psychology, the only STEM major in those early days of the four-year college, counted only two women among its eight graduates in 1953, and men accounted for all those with majors in Philosophy (8), History (2), Sociology (2), and the Pre-Ministerial track (7).
I’d have to do a lot more work to see if such data are just blips or if they signal recurring trends. But these two snapshots fit with a few of my initial assumptions. First, I’m not surprised that women in that era were underrepresented in seminary feeder programs, given that limits on women in ministry were only starting to change at that time in denominations like the Baptist General Conference.
On the other hand, it’s equally predictable that so much of the swelling female student population went into education programs. Not only did those majors offer access to jobs that had been open to women longer than other professions, but in that era of Bethel history, Education was one of the few fields where students encountered multiple women professors. The faculty of instruction list in the 1972-74 catalog includes just nine women, four of them in Education or Physical Education: Patricia Brownlee, Ruth Ludeman, Carol Morgan, and Education department chair Junet Runbeck.
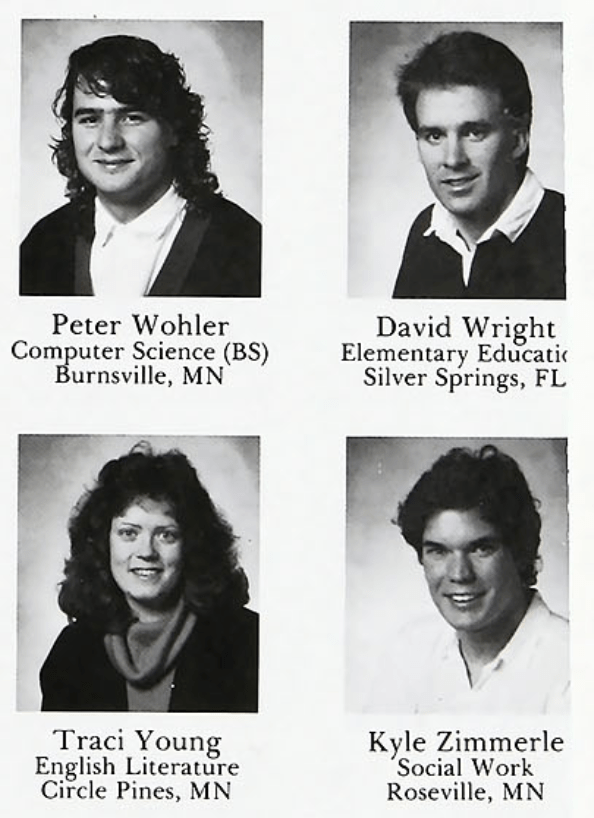
By the same token, you’ve no doubt noticed the absence of two professional majors that weren’t in the catalog in 1972-73 but have long since become the most popular programs in the College of Arts and Sciences: Business (which started in the mid-Seventies) and Nursing (early Eighties). So let’s take a look at how majors were distributed in 1988-89, the last yearbook to be held in our digital library. That edition included a senior class nearly three times as large as the first at Arden Hills — 386 seniors (58% women) — so this time I’ll only list programs claiming at least 10 graduates.
PREDOMINANTLY WOMEN IN 1988-89
Nursing (96%), Elementary Education (90%), Social Work (89%), Speech Communication (82%)
MOSTLY WOMEN IN 1988-89
Music (70%, including Church Music and Sacred Music), Art (63%), Psychology (59%), Political Science (55%)
MOSTLY MEN IN 1988-89
Biology (42%), Business (34%), History (31%)
PREDOMINANTLY MEN IN 1988-89
Computer Science (18%)
That year all of the graduates in Philosophy (7), Chemistry (6), and Economics (3) were men. It is striking to see that while women make up the majority of students in English in all of our cases so far, they are significantly underrepresented in two other core humanities fields: Philosophy (where I haven’t noticed a single woman in the three yearbooks surveyed) and History. Here too, I’d suggest the importance of having male-only faculties, which only changed permanently in those departments as we enter the Nineties and Oughts. It’s also noteworthy that if you add Social Studies Secondary Education to the mix, the History divide in the Class of 1989 is nearly 50/50.
The creation and development of the Nursing program will obviously be a key story in our project, since it has always been dominated by women on both the student and faculty side. But I’ll be curious to see if programs in Business and the STEM fields have remained as strongly gendered over time. To start to check that, let’s turn to another kind of historical evidence.
Government Statistics
If you study higher ed in the United States, you’ll probably find yourself using something called “IPEDS” before too long. Maintained by the U.S. Department of Education, the Integrated Postsecondary Education Data System collects a wide variety of statistical information from the nation’s thousands of degree-granting institutions of higher learning. At least when it comes to degree completions, numbers for at least some schools go back as far as 1986-87.
Like my first type of evidence, IPEDS is imperfect: it relies on institutions to report their own data, and how those numbers is classified can be confusing. (For example, I think that bachelor’s degree data cover both traditional undergraduate and adult/degree completion programs at Bethel.) But it does give us a more reliable way to answer questions like those that began this post — not only providing years’ worth of data on majors that can be broken out by gender and race, but (time permitting) letting researchers compare institutions to each other.
(Note that my figurative microscope has been zoomed in so tightly on Bethel that I haven’t stepped back to provide larger context — e.g., was Bethel typical of colleges its size or type in having some majors be more gendered than others?)
It’s going to take me a while to crunch all these numbers for recent decades. But just provide one more recent snapshot, here’s what we learn from 2021-22, the most recent year for which we have degree completions broken out by major and gender. Here again, I’ll limit myself to programs with at least 10 graduates (sometimes combining closely related majors to get there), and I’m including second majors, so there’s double-counting.
Note that in 2021-22 Bethel awarded approximately two-thirds of its 677 bachelor’s degrees to women.
PREDOMINANTLY WOMEN IN 2021-22
Elementary Education (98%), English + Journalism (92%), Nursing (89%), Social Work (88%), Graphic Design + Studio Art (83%), Psychology (80%), Music + Theatre Arts (80%), Special Education (78%)
MOSTLY WOMEN IN 2021-22
Neuroscience (73%), Communication Studies + Organizational Communication (68%), Biology (63%), Exercise Science + Bioenergetics (58%), History + Philosophy + Political Science (56%)
MOSTLY MEN IN 2021-22
All secondary education programs (47%), Business + Accounting + Economics (46%), Chemistry + Biochemistry (42%), Physics (40%), BTS + Missional Ministry (36%)
PREDOMINANTLY MEN IN 2021-22
All engineering programs (15%), Computer Science (12%)
(How does that compare with Bethel’s closest cousin — geographically and culturally — among Minnesota colleges and universities: the University of Northwestern-St. Paul? Its 2021-22 IPEDS numbers for English Literature (90%), Elementary Education + Early Childhood Education (89%), Nursing (87%), and Psychology (76%) were similar to those for Bethel, while Communication Studies + Public Relations at UNWSP (88%) featured an even higher share of women than did similar programs up the road. Northwestern’s majors in Business and Accounting, like Bethel’s, were relatively balanced in terms of gender, while Biology (32%), Kinesiology (32%), and Engineering (26%) reported many fewer women.)
While there are definitely fluctuations over time, these four snapshots at least suggest three Bethel stories I may want to explore in greater depth:
1. Women at Bethel continue to dominate professional programs that feed into careers with long traditions of female employment: Education (especially at the preK-6 level), Nursing, and Social Work.
2. While Bethel women have long been well represented in Psychology and have made significant gains in life sciences, they remain a minority in other STEM fields.
One goal of this blog is to help involve members of the Bethel community in doing the history of Bethel, so comments are always welcome! Just know that if you leave a comment at the project blog, I’ll take that as expressing your permission to quote it in the project.
